PigVision does not have a dedicated feature for recording welfare issues such as tail biting in the herd. However, by using the "Treatment" function, it is possible to record the number of tail-biting incidents and create a simple graph.
Setting Up a Registration List
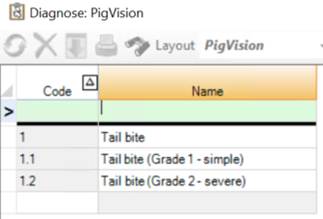
Under "General" → "Medicine/Vaccination" → "Diagnosis", create codes for, for example, "Tail Biting".
Next, under "General" → "Medicine/Vaccination" → "Medication", create a code called "Tail Biting".
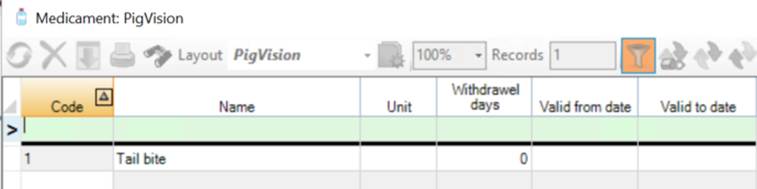
Finally, create a journal. It is not important what is entered in the columns "Treatment", "Dosage", etc., as the purpose is solely to record the number of tail-biting incidents.

Recording Tail Biting
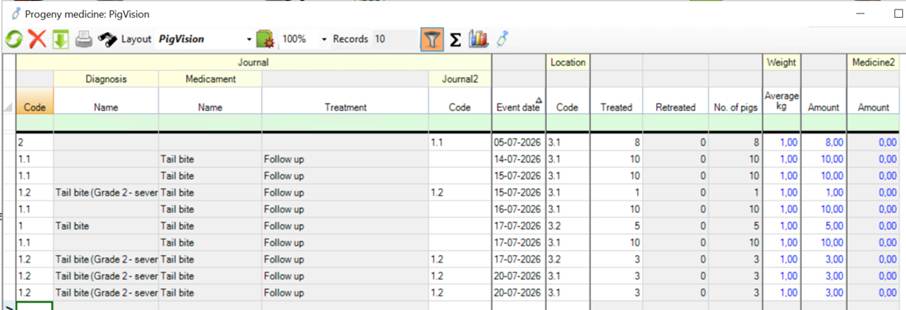
By going to "Growing Pigs" → "Treatment", you can now record the number of tail-biting incidents in the same way as you would register a medical treatment.
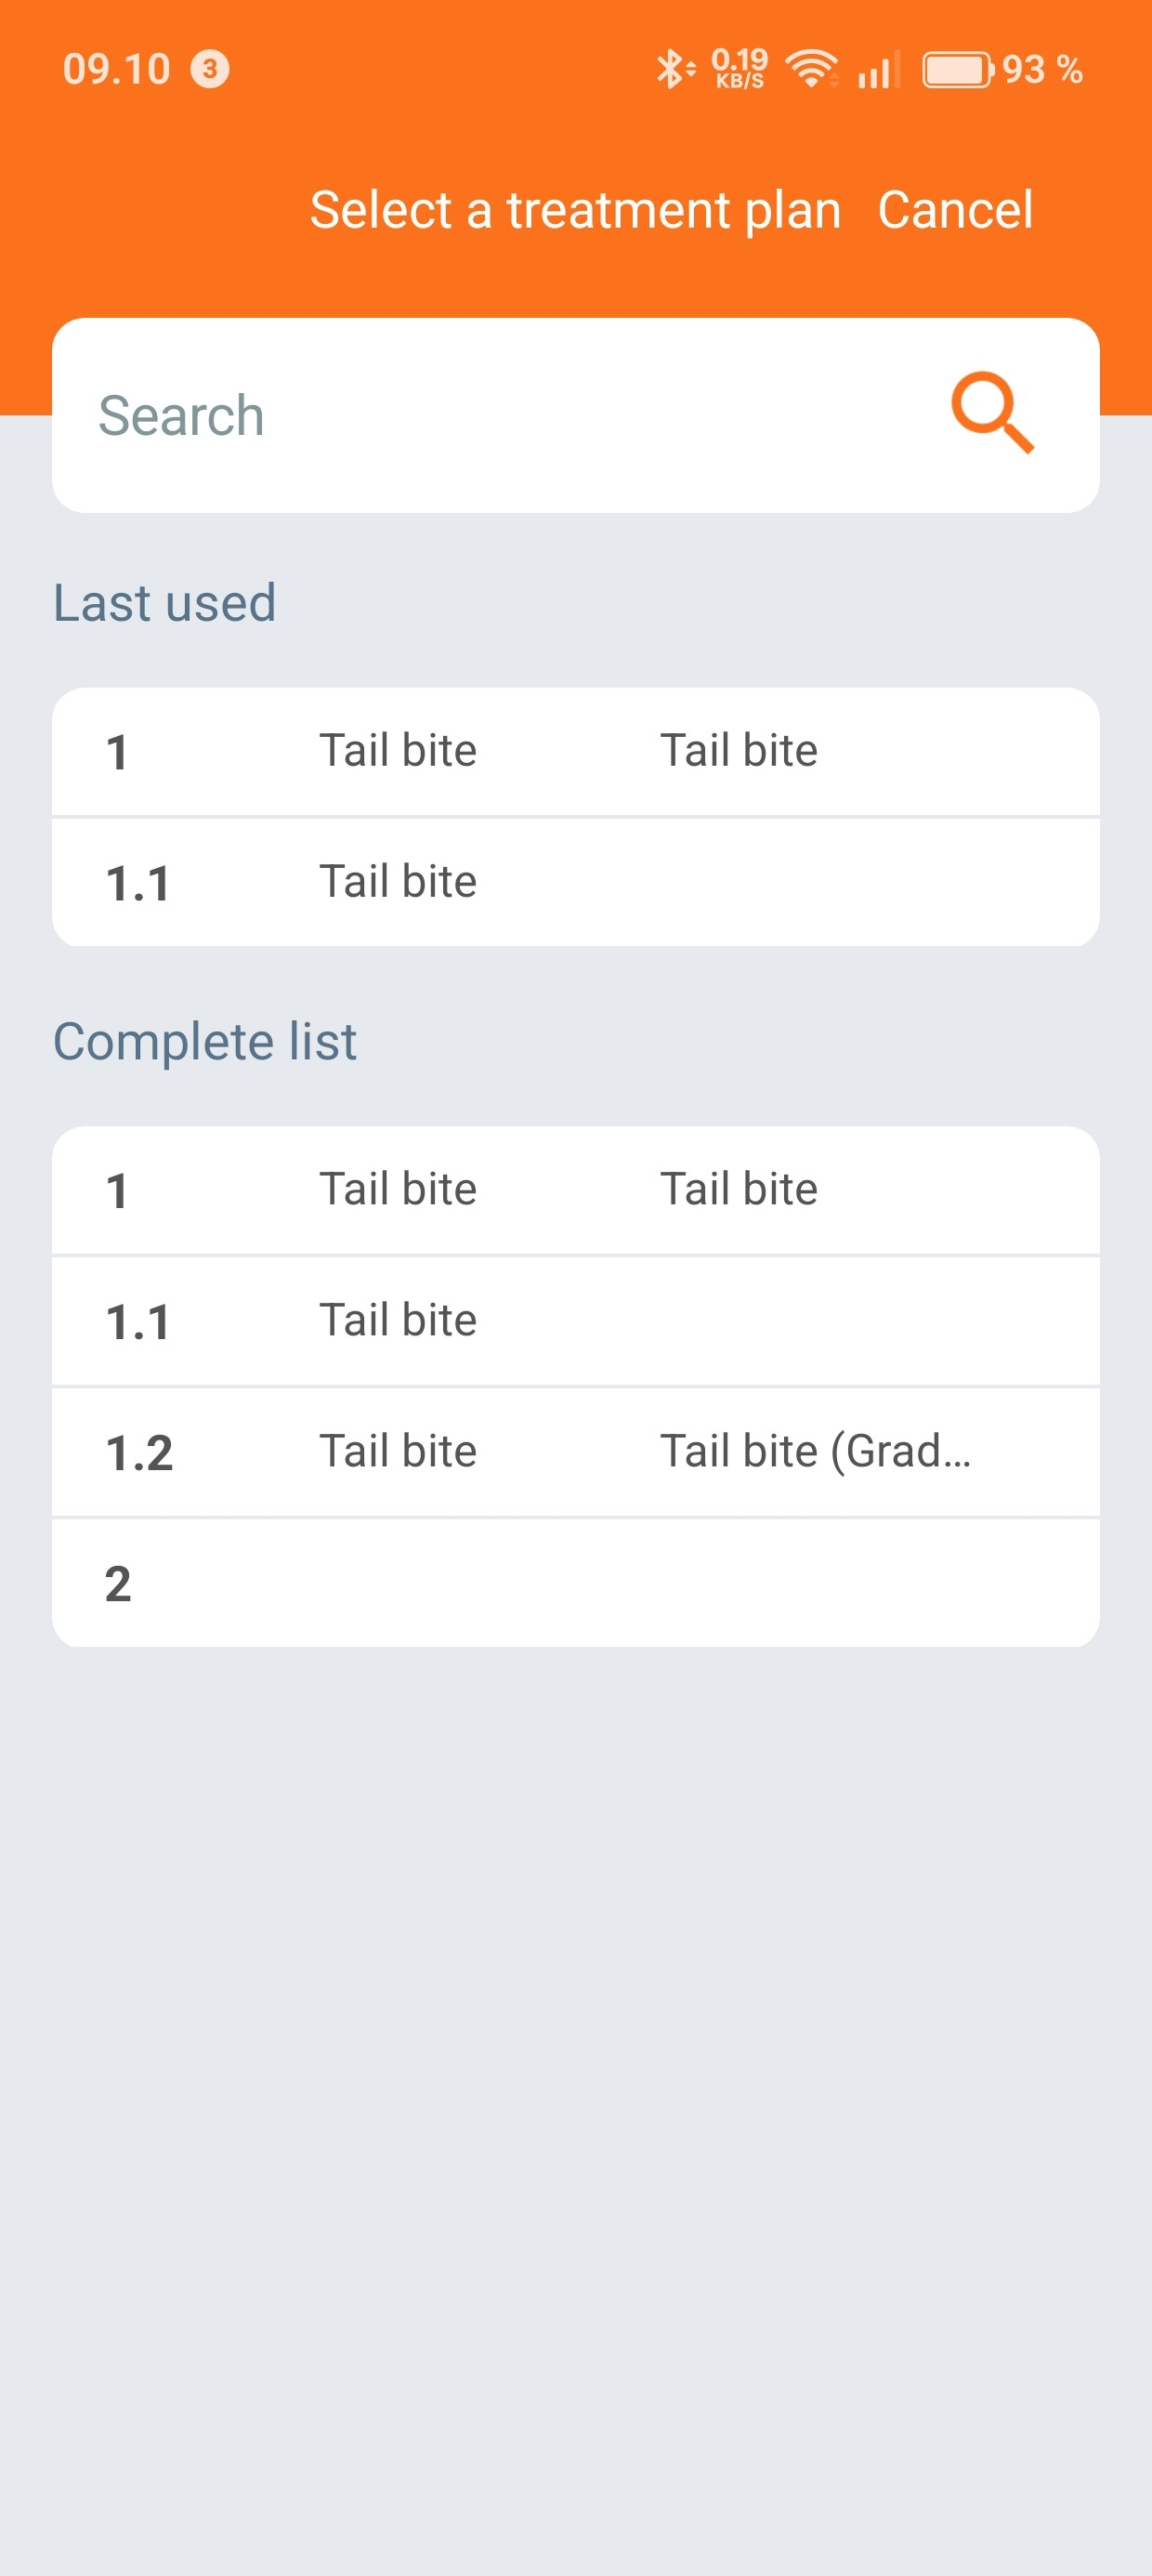
Fill in first the kode for tail bites – either 1.1 for simple tail bite or 1.2 for a severe.
Using the App for Registration
The registration can also be carried out in the app, just like medical treatments, making it quick and easy to record incidents directly in the barn.
Viewing Trends in Tail Biting
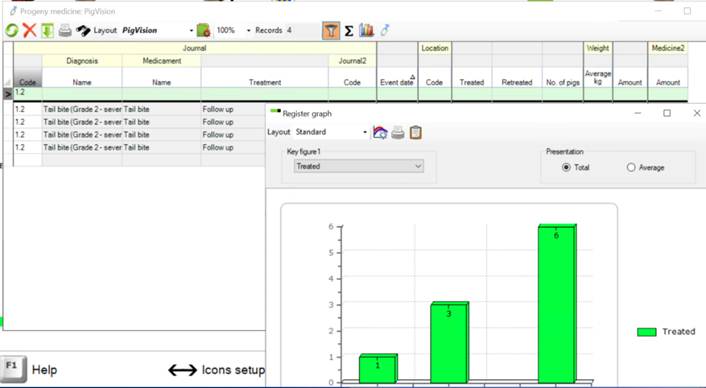
If you want a graphical overview of the number of tail-biting incidents over a period of time, you can apply a filter and display, for example, "Grade 1" or "Grade 2" on a graph.
Since the program is designed for treatment records rather than welfare observations, it is only possible to display all tail-biting registrations within a selected period. However, you can create the graph twice, once for Grade 1 and once for Grade 2, to gain a clearer overview of the development.
Insert a filter. In the example shown below, 1.2 (Grade 2) is selected.
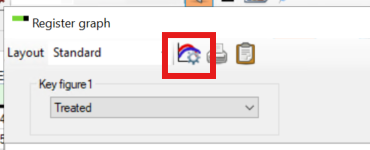
To change layout on graff - click "Graph Setup".
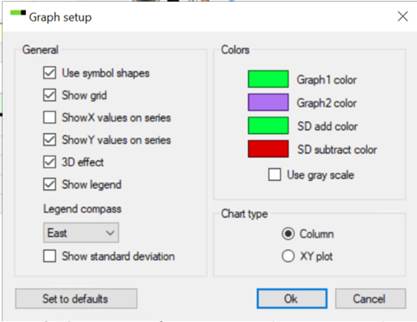
Then select the color for "Graph 1" and set "Chart Type" to "Column".
Export to Excel and Create Additional Graphs
You can export the tail-biting registration data to Excel and create additional graphs and analyses.
First, filter the data so that only tail-biting registrations are displayed by entering "Tail"* in the filter line.
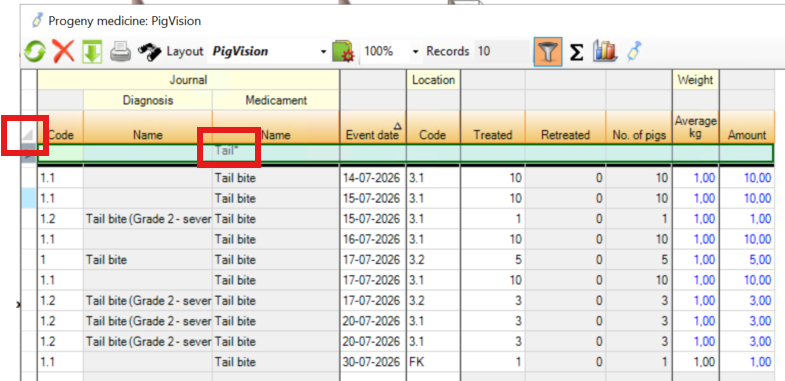
Next, click the triangle in the upper-left corner to select the entire table. Then press Ctrl + E on your keyboard to export the data to Excel. Excel will open automatically if it is installed on your PC.
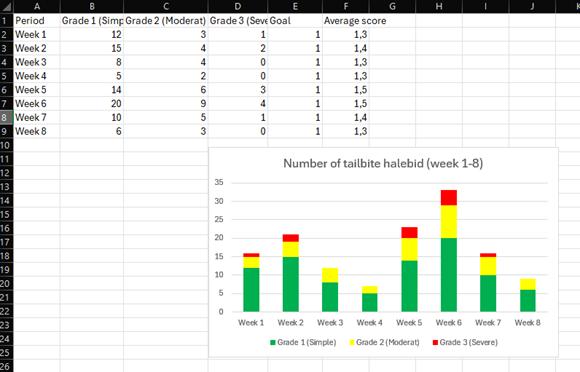
In Excel, there are almost unlimited possibilities for illustrating trends in the recorded observations or treatments. An example is shown below. Is this there is three grades of tail bite – just to illustrate the possibilities.